Bitcoin Explodes Above $63K as the Bulls Eye This Level Next (BTC Price Analysis)
Bitcoin’s price has been going through some major moves throughout the past couple of weeks. The bulls are fighting to reestablish their dominance, staging a convincing recovery above $60K. But will it last? Technical Analysis By TradingRage The Daily Chart The price has been oscillating inside a descending channel on the daily chart for the […]

Bitcoin’s price has been going through some major moves throughout the past couple of weeks. The bulls are fighting to reestablish their dominance, staging a convincing recovery above $60K. But will it last?
Technical Analysis
By TradingRage
The Daily Chart
The price has been oscillating inside a descending channel on the daily chart for the past couple of months. The channel was briefly broken to the downside a few days ago.
However, BTC quickly rebounded and climbed back inside the channel, making a fake bearish breakout. With the $60K level also turning into support, the price will likely target the $68K resistance level in the short term.

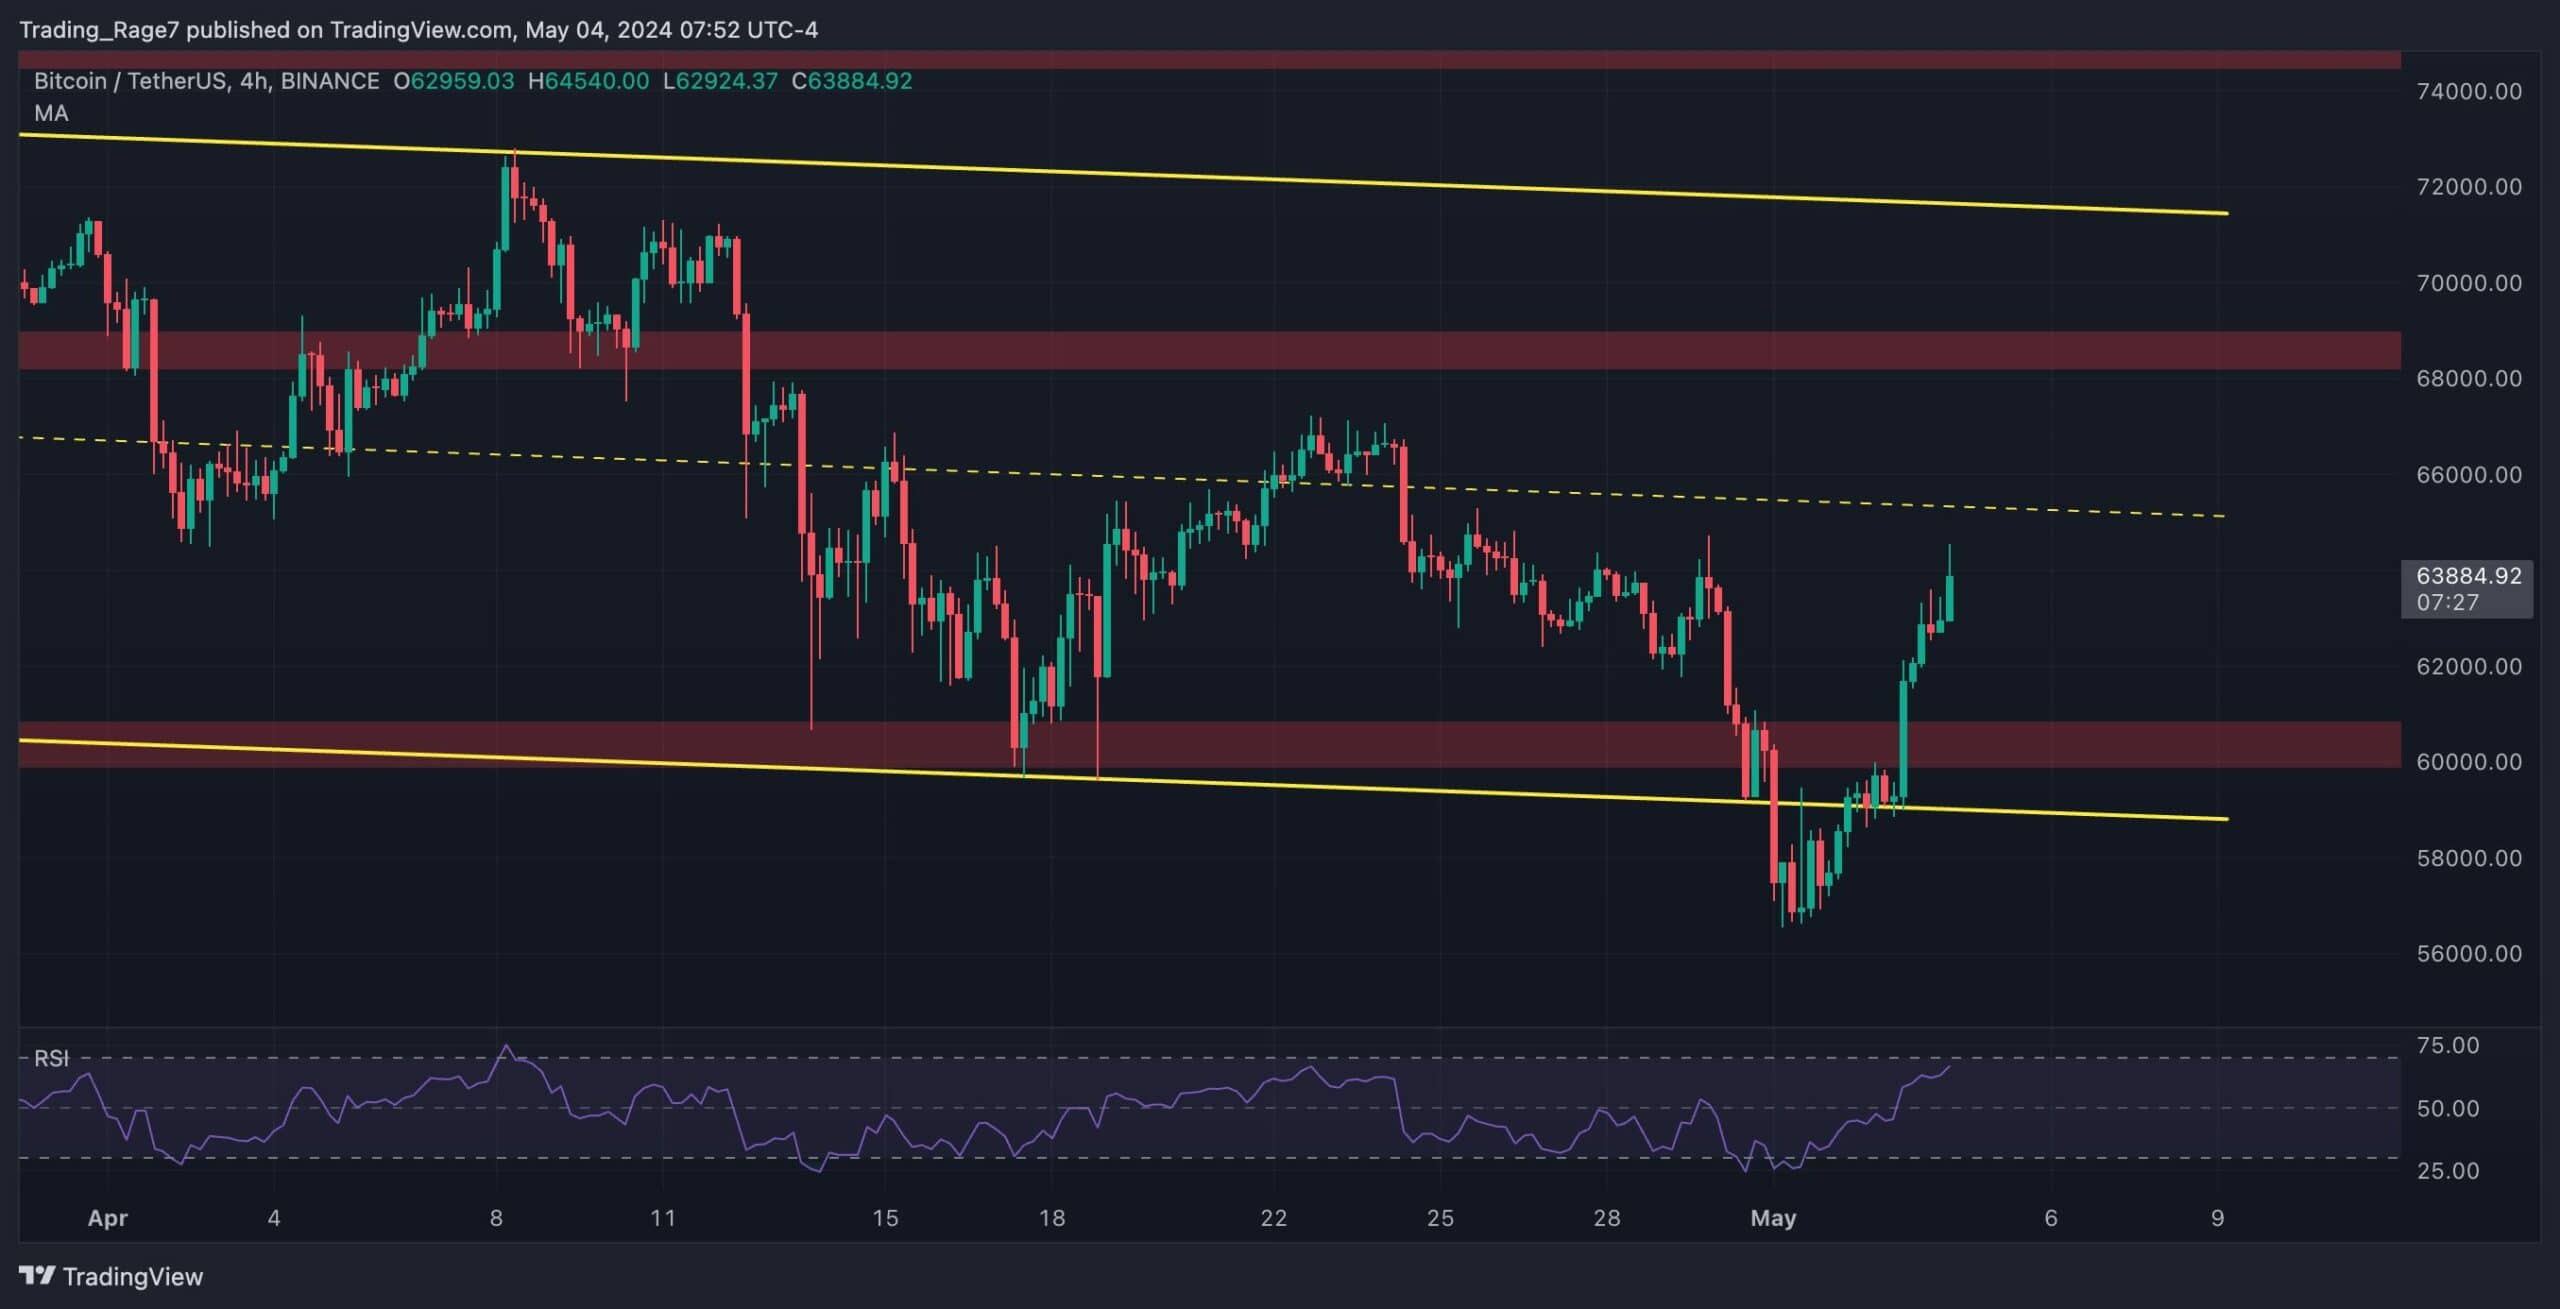
The 4-Hour Chart
Looking at the 4-hour chart, it is evident that the price has quickly recovered from below the channel and the $60K level. The midline of the descending channel is now the next target.
Meanwhile, with the RSI approaching the overbought zone, the price might experience a pullback soon. The continuation of the bullish trend is dependent on whether the price can finally break the channel to the upside.
On-Chain Analysis
By TradingRage
Bitcoin Miners Position Index
While Bitcoin’s price has been trading below the $75K level, many market participants have been offloading their coins as they assume that the bull market might be over or a much deeper pullback is probable. However, miners are not in this group.
This chart demonstrates the Miners Position Index (MPI) metric. It measures miners’ selling pressure. Values above 2 can be considered dangerous, as they show massive destruction by the miners.
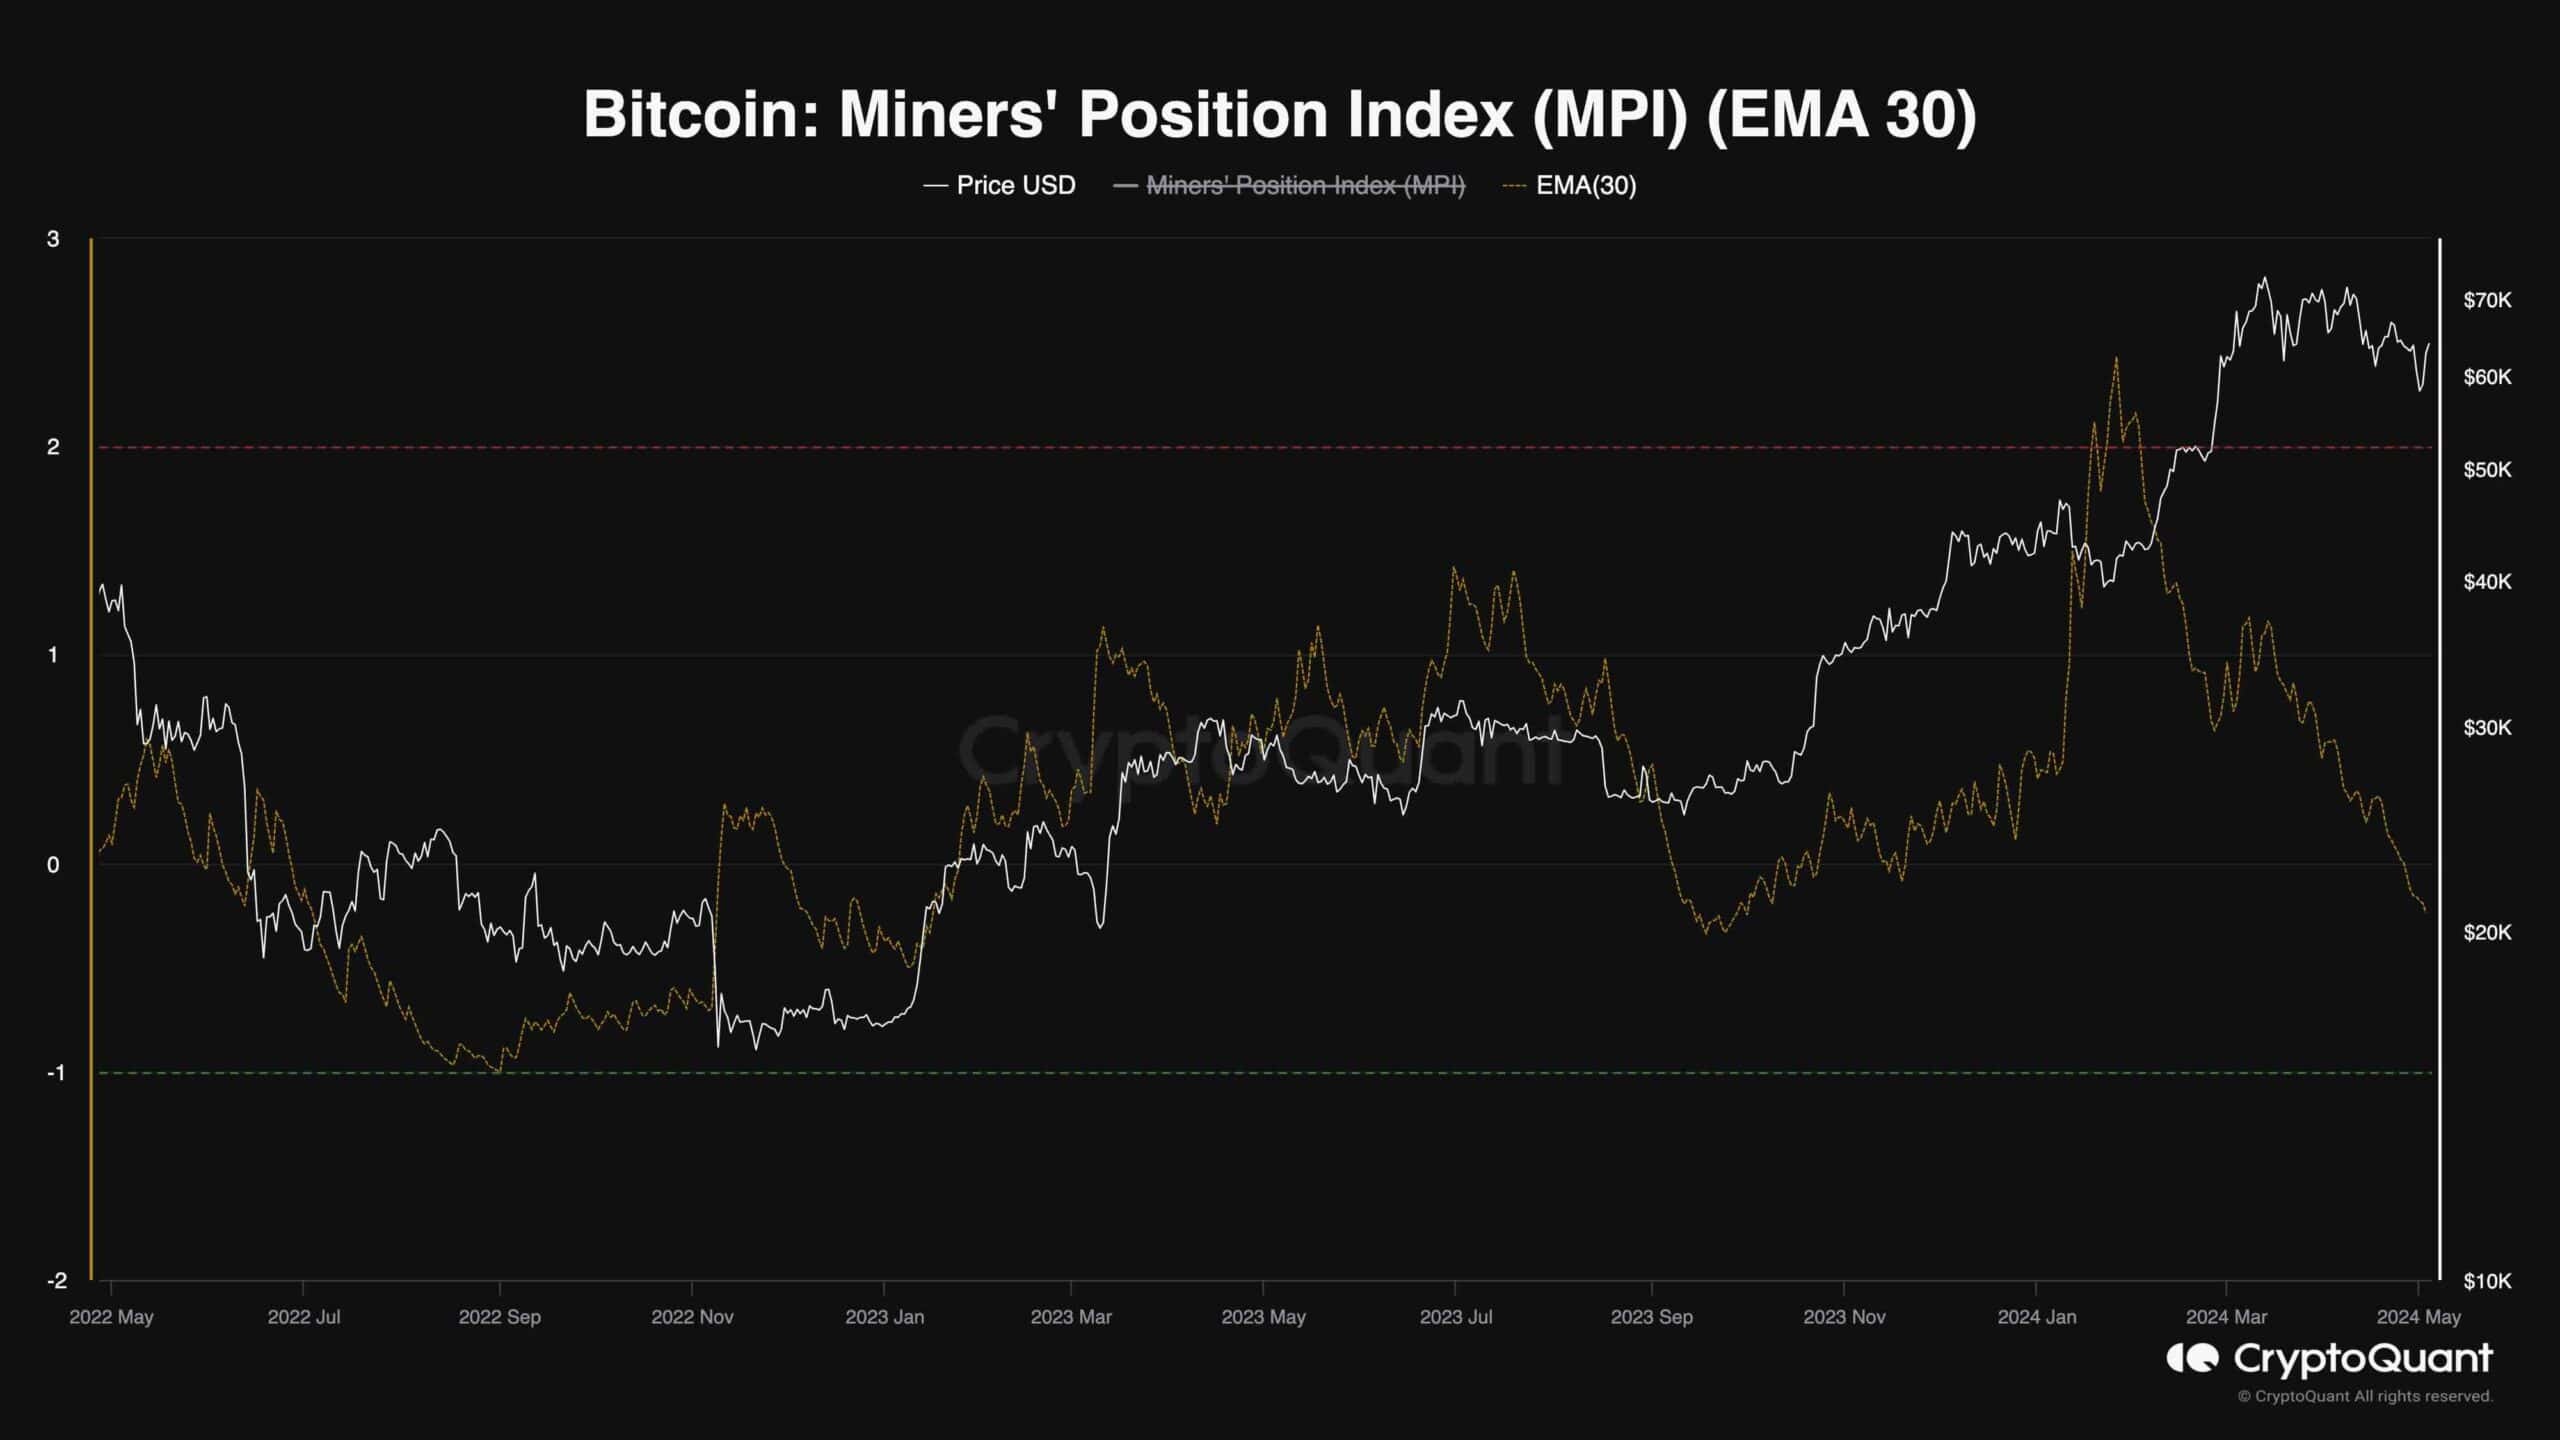
As the chart depicts, the MPI has been dropping rapidly over the last few months. This is a good sign, as the Miners’ selling pressure is declining. Thus, with sufficient demand, Bitcoin’s price can once again begin a rally toward $80K and even higher prices.
The post Bitcoin Explodes Above $63K as the Bulls Eye This Level Next (BTC Price Analysis) appeared first on CryptoPotato.