Huge Move Incoming For Bitcoin? Price Consolidating Near Pivotal Level: BTC Price Analysis
Bitcoin’s price has been relatively inactive for the past few weeks, struggling to surpass the $30K resistance level. The current phase appears to be corrective, marked by minor rejections, with significant support found at the 100-day MA. Technical Analysis By Shayan The Daily Chart The daily chart shows a corrective movement since the rejection at […]
Bitcoin’s price has been relatively inactive for the past few weeks, struggling to surpass the $30K resistance level. The current phase appears to be corrective, marked by minor rejections, with significant support found at the 100-day MA.
Technical Analysis
By Shayan
The Daily Chart
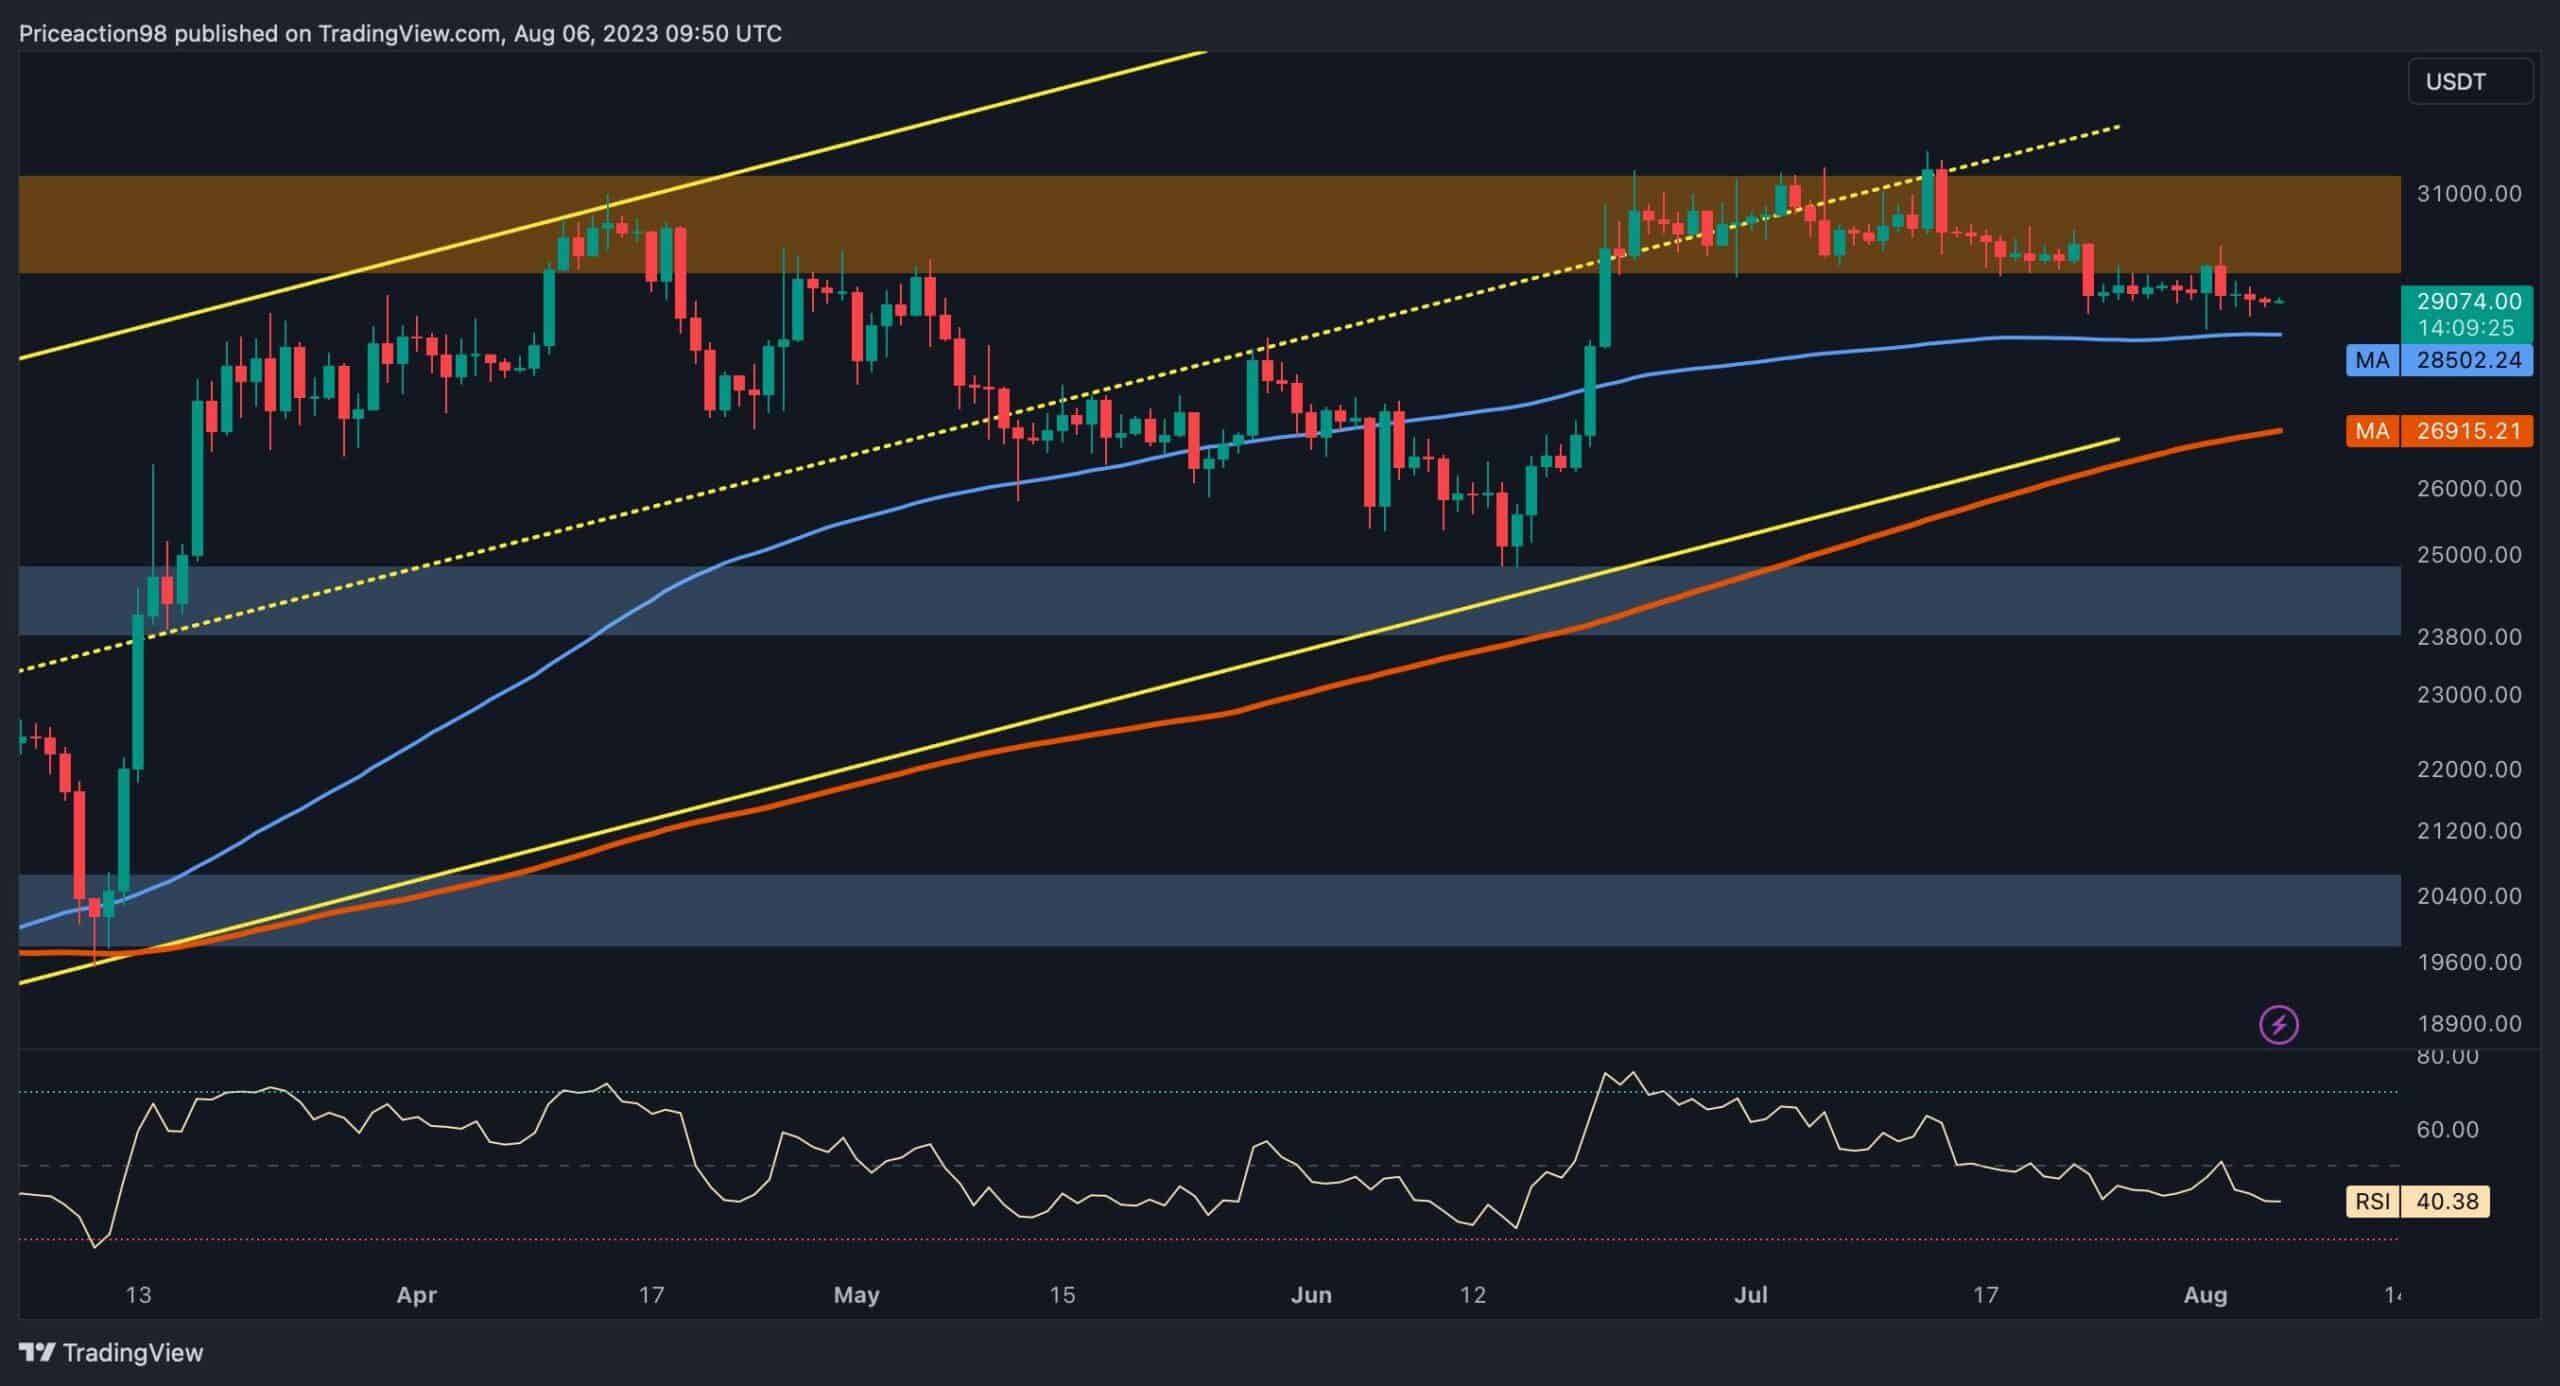
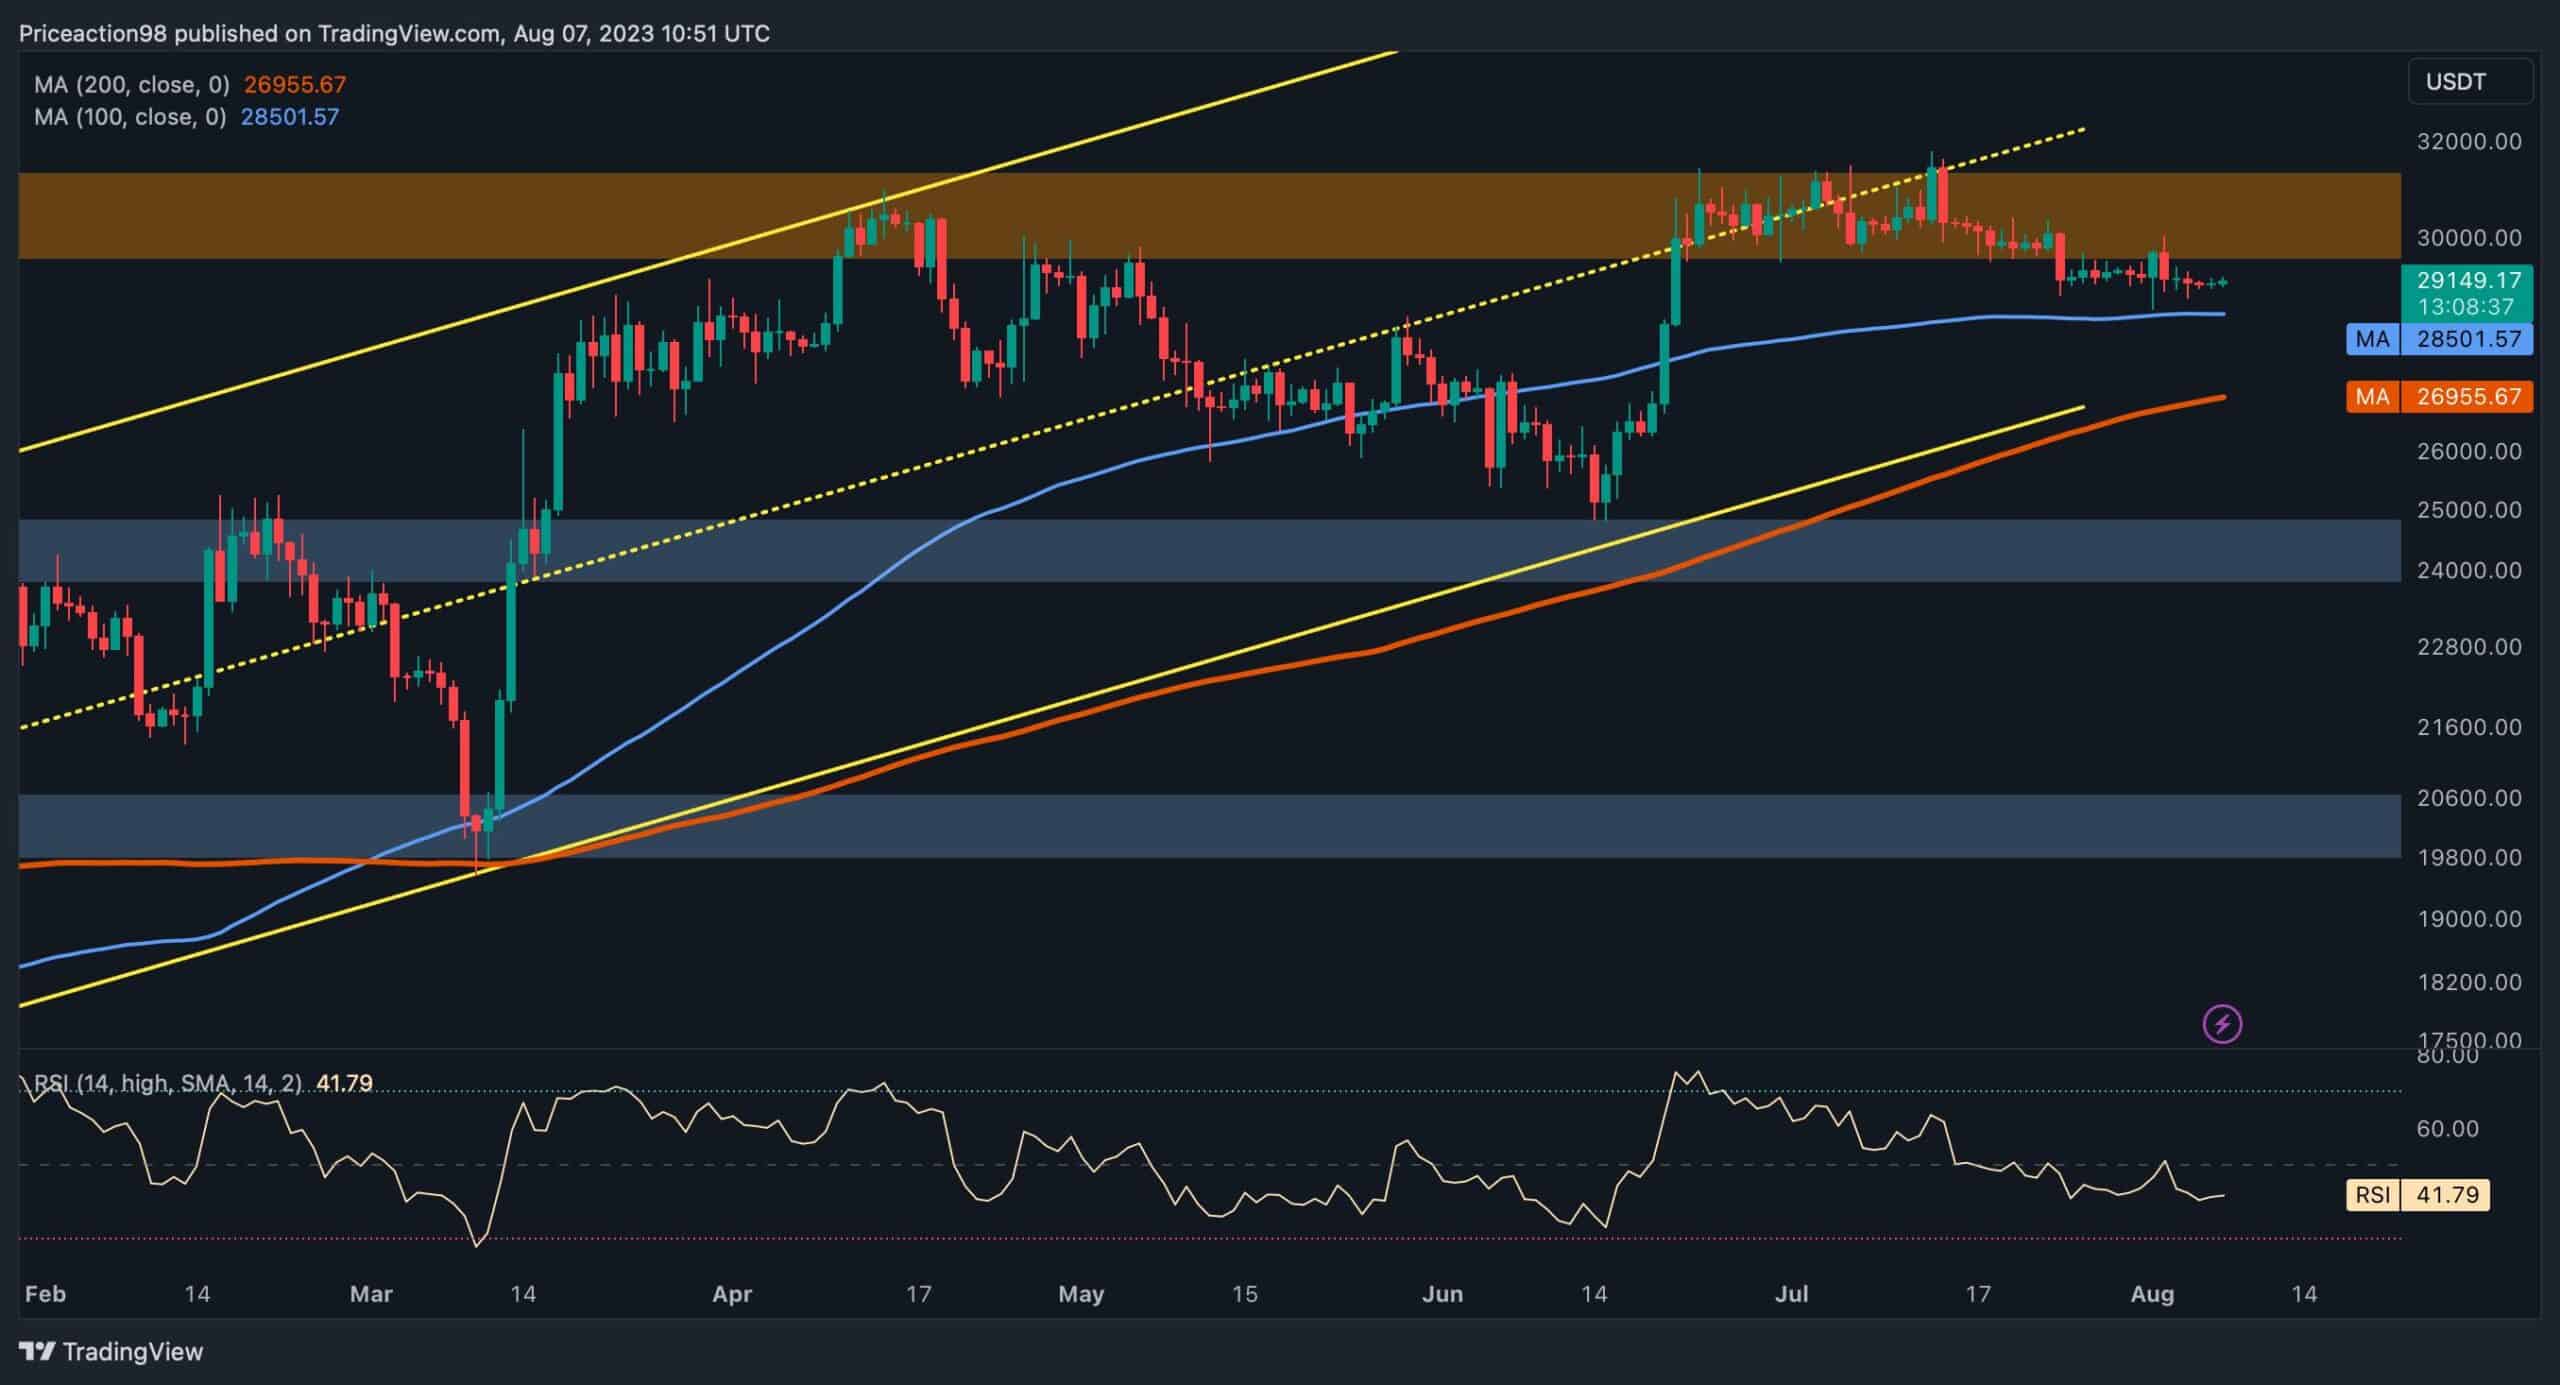
The daily chart shows a corrective movement since the rejection at $30K, with a gradual retracement towards the 100-day moving average at $28.5K. This moving average has served as a solid support, preventing further declines for several months.
However, a drop below the 100-day MA may signal the sellers’ focus on the 200-day moving average and the lower boundary of the multi-month channel. The 200-day MA holds considerable importance as it could act as support and drive the price higher.
Nevertheless, if BTC finds support at the 100 or 200-day MAs and ultimately manages to reclaim the $30K level, it may trigger a rally toward the $38K resistance zone in the coming weeks.
The 4-Hour Chart
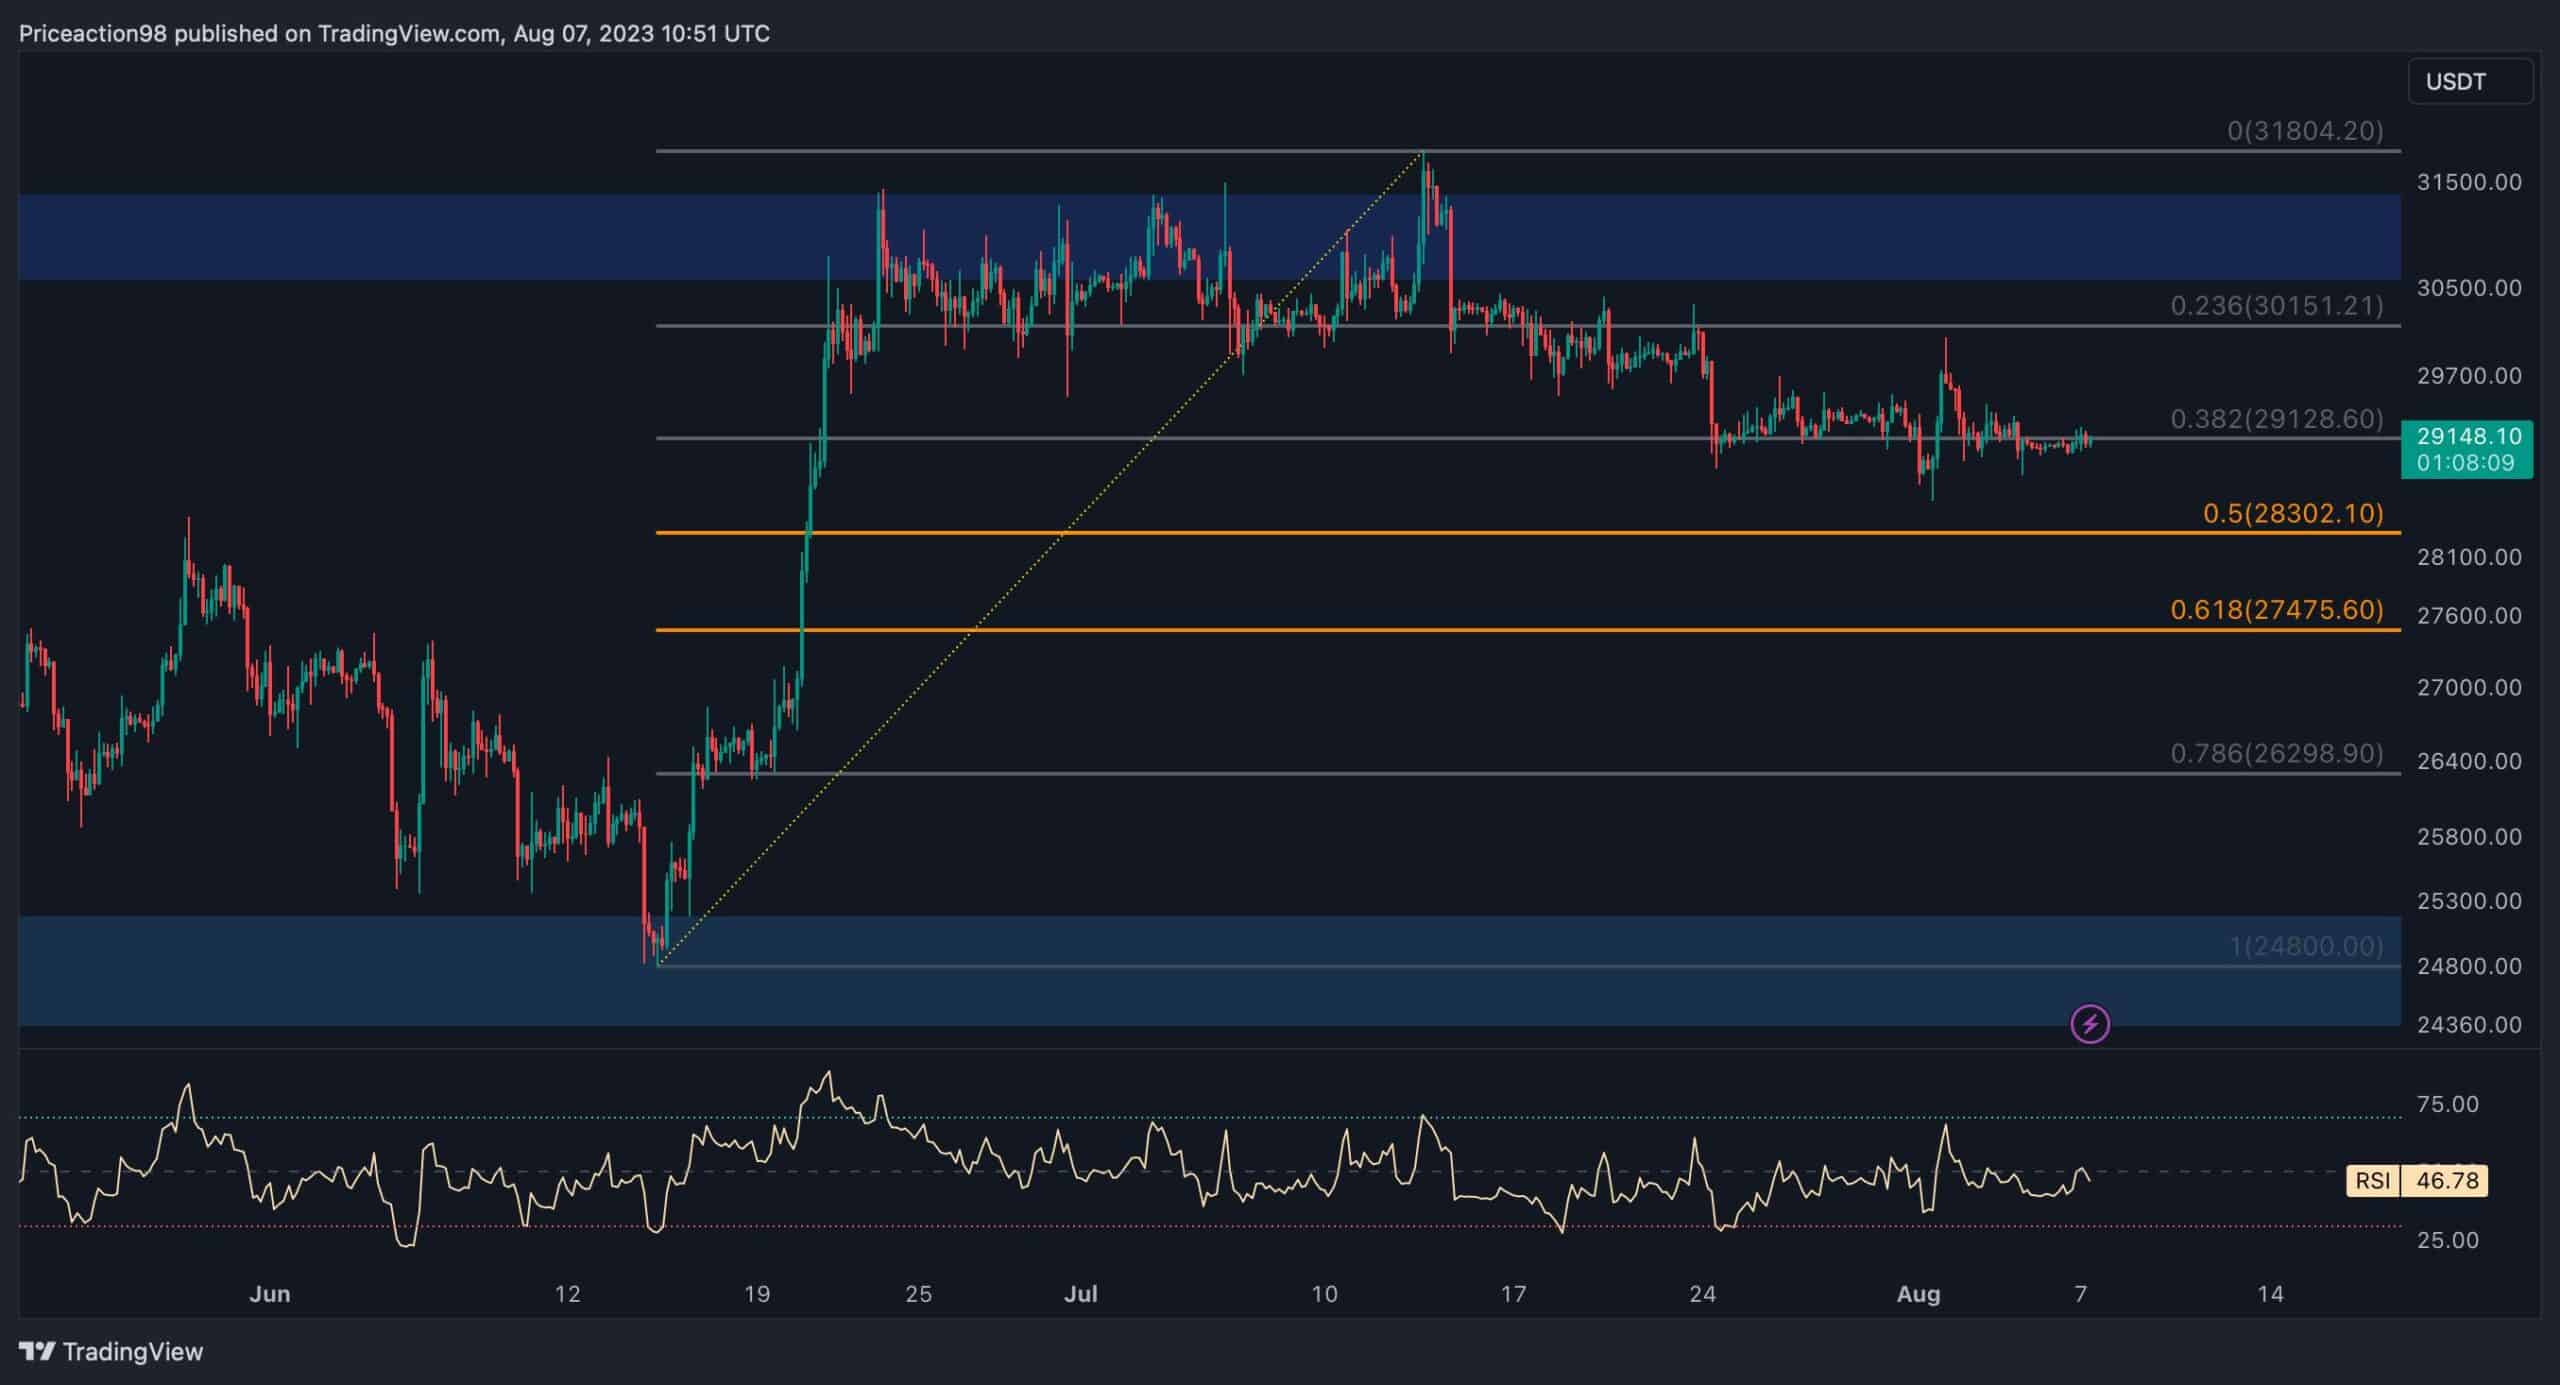
On the 4-hour chart, the price appears to be confined within a static range, oscillating between $30K and $25K resistance and support levels, respectively. The ongoing correction stage began in early July, with the price approaching the critical 0.5 and 0.618 Fibonacci retracement levels. This region serves as a crucial support and might be the target for the current correction.
A supportive reaction in this area could lead to a new bullish phase and a surge in price. However, if the cryptocurrency breaks below the range between the 0.5 and 0.618 Fibonacci levels, it may rapidly decline towards its lower threshold, around $25K.
On-chain Analysis
By Shayan
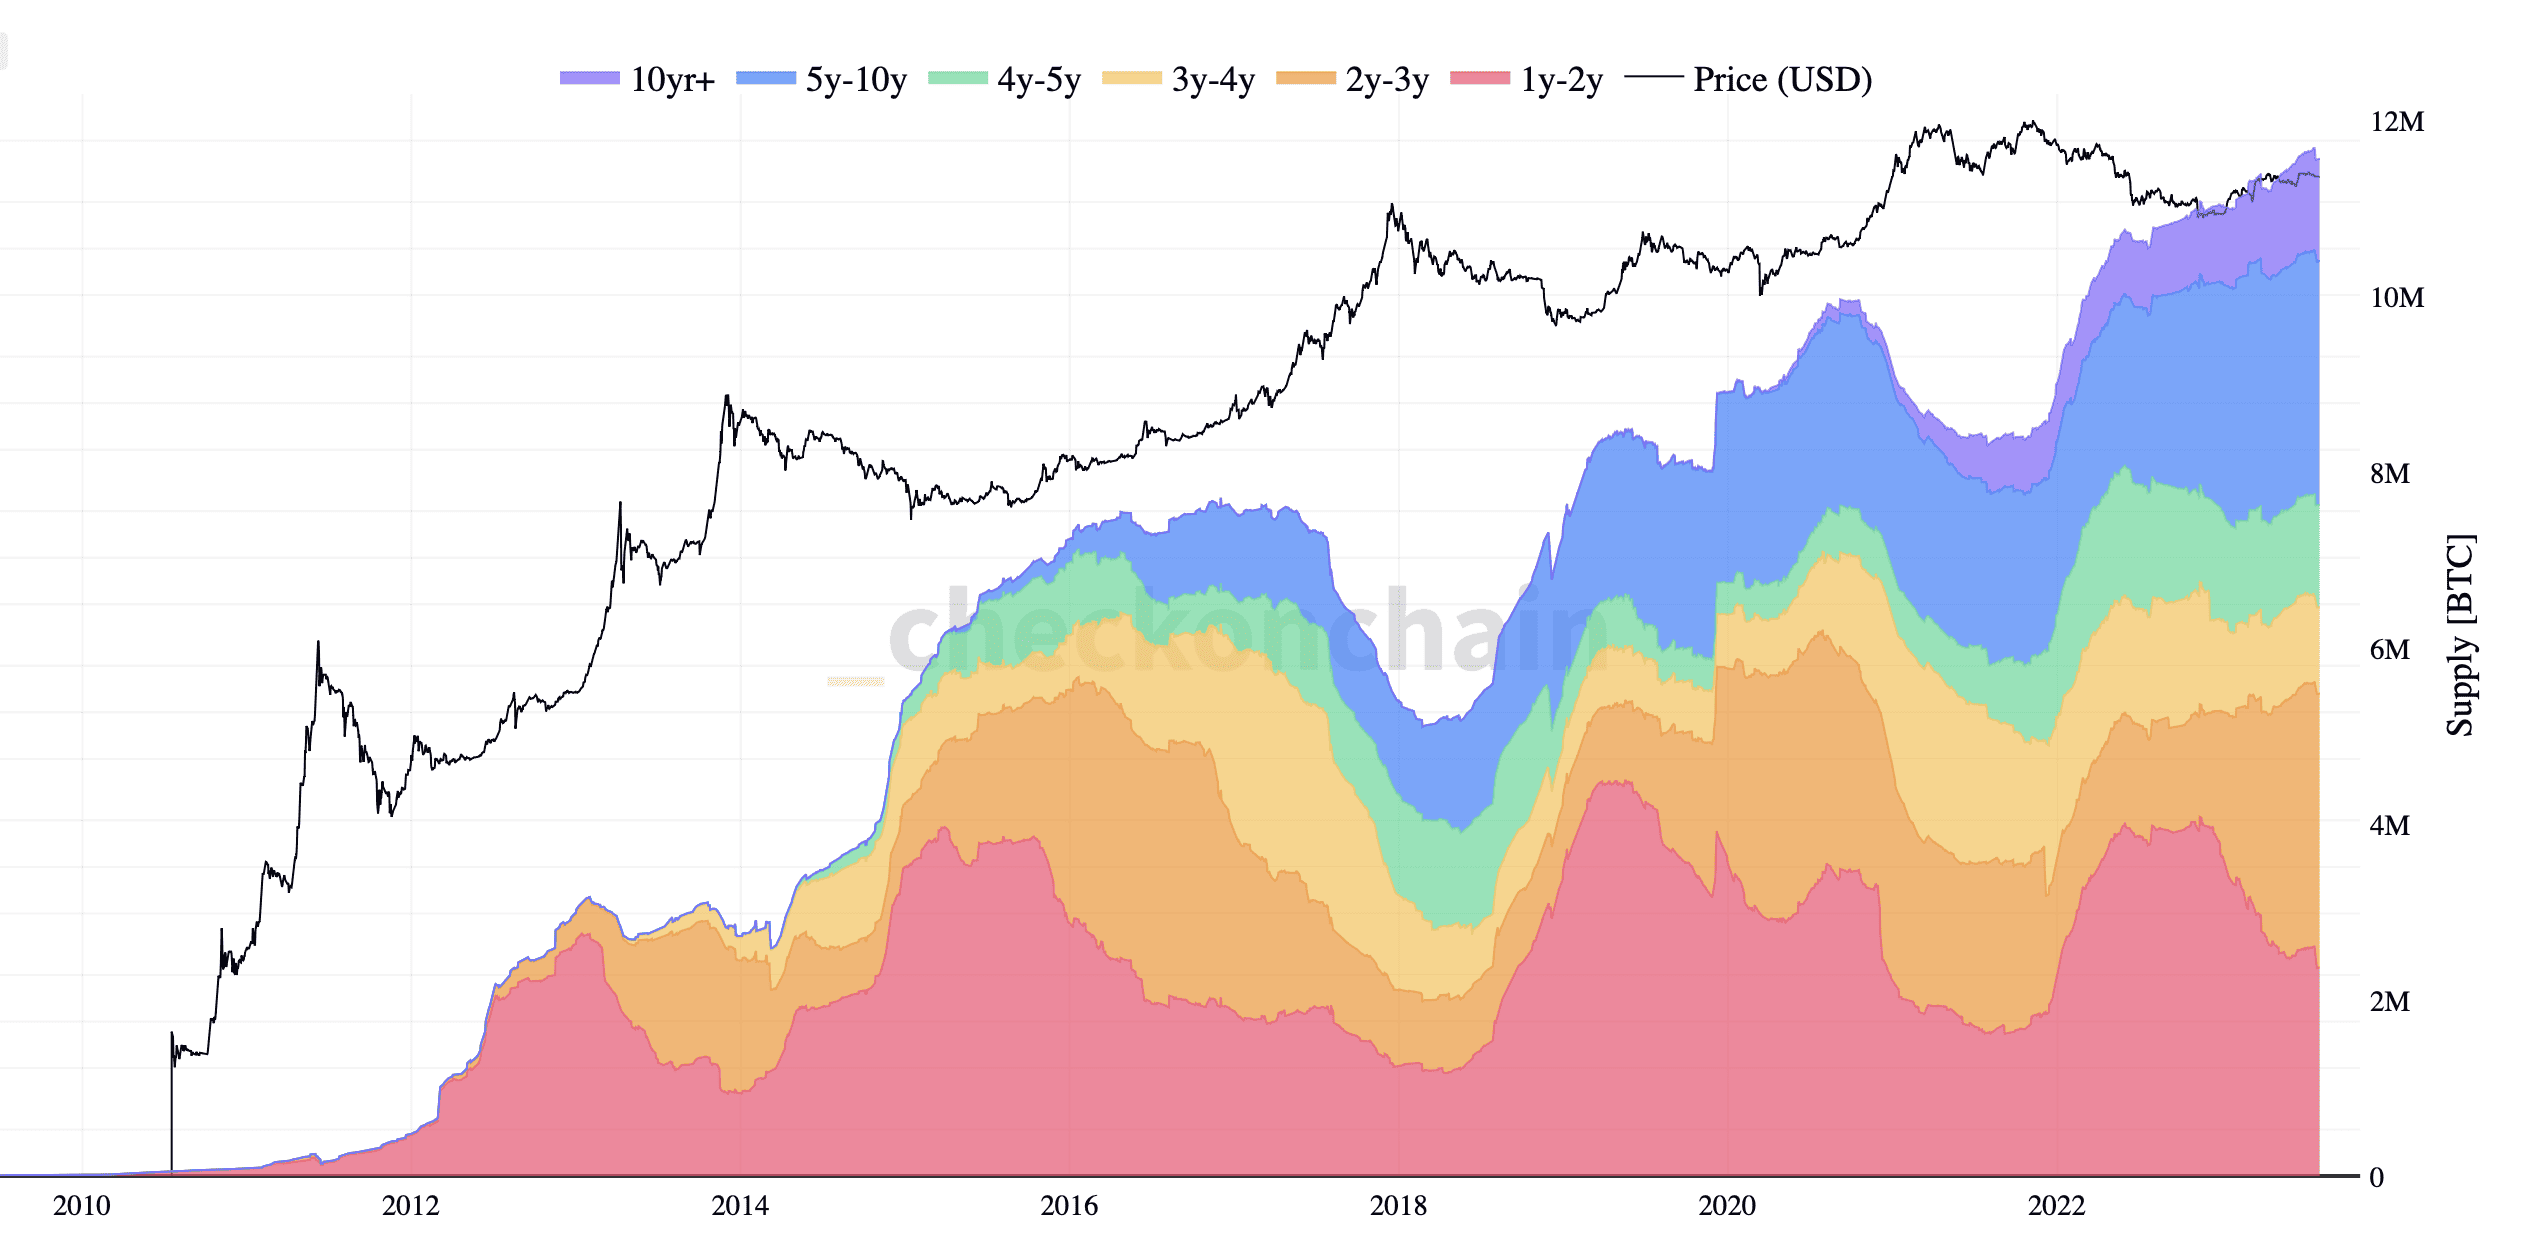
This chart demonstrates Bitcoin’s supply that has been dormant for over a year. It’s fascinating to see that around 69.2% of all BTC hasn’t been transferred for more than a year. This shows that many holders firmly believe in its long-term value, despite its volatile nature.
If we look closer, about 55.7% of Bitcoin has stayed untouched for over two years, indicating a strong “HODLing” strategy among these participants. This trend continues, with roughly 40.1% of Bitcoin remaining dormant for more than three years, showing unwavering faith in Bitcoin’s potential.
Finally, those who have held onto their Bitcoin for over five years make up around 29.1% of the total supply, showcasing their long-term commitment to Bitcoin. This “HODLing” strategy significantly affects Bitcoin’s price. When a large portion of Bitcoin stays inactive, it reduces the available supply in the market. This, combined with increasing demand, can push the price higher in the long term due to scarcity.
The post Huge Move Incoming For Bitcoin? Price Consolidating Near Pivotal Level: BTC Price Analysis appeared first on CryptoPotato.